
The tables below give information about the world population and distribution in 1950 and 2000, with an estimate of the situation in 2050.
Summarise the information by selecting and reporting the main features, and make comparisons where relevant.
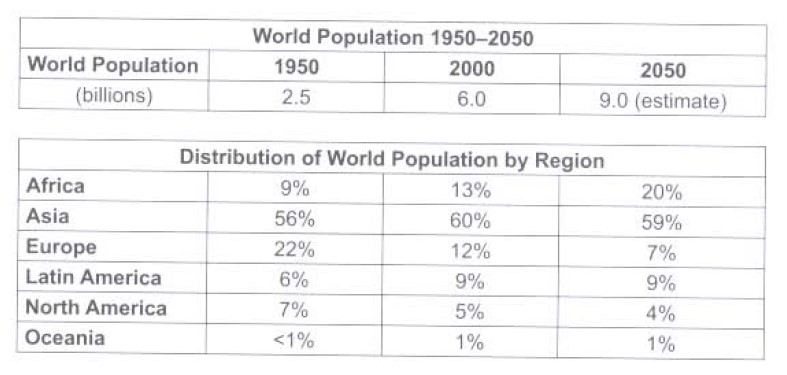
The table compares the proportion of people and their distributions among six different regions in the globe in 1950 and 2000, with anticipated totals for 2050.
Overall, it can be seen that while the population of people in Asia and Africa is set to grow, Europe and North America will witness a drop in the population. A striking feature is that Oceania is likely to remain stable throughout the given time bracket and Latin America’s population will also remain more or less the same.
A glance at the graph reveals that Asia stood at 56% in 1950, which was the highest percentage among all given distributions, and the figure is set to experience a gradual swell to 59% in 2050. Europe held 22% of the count of the gross populace in 1950 which almost halved in 2000 and is further foreseen to slump to 7% by the mid of 21st century. Latin America had 6% of the world’s net population; this figure rose to 9% in 2000 and is forecasted to stay uniform in 2050.
Probing further, the population was only 7% and 5% in 1950 and 2000 correspondingly for North America and is going to shrink marginally to 4% over the following fifty years. Nonetheless, Africa will have nearly doubled by 2050 from 9% to 20%. The gross world population by the mid of 20th century was 2.5 billion which became more than double in 2000. It is estimated to escalate to 9 billion by the year 2050.
