
The chart below shows the results of a survey that sampled a cross section of travelers at a major metropolitan airport about the purpose of their trip. The survey was carried out during four different months in 2002.
Summarize the information by selecting and reporting the main features, and make comparisons where relevant
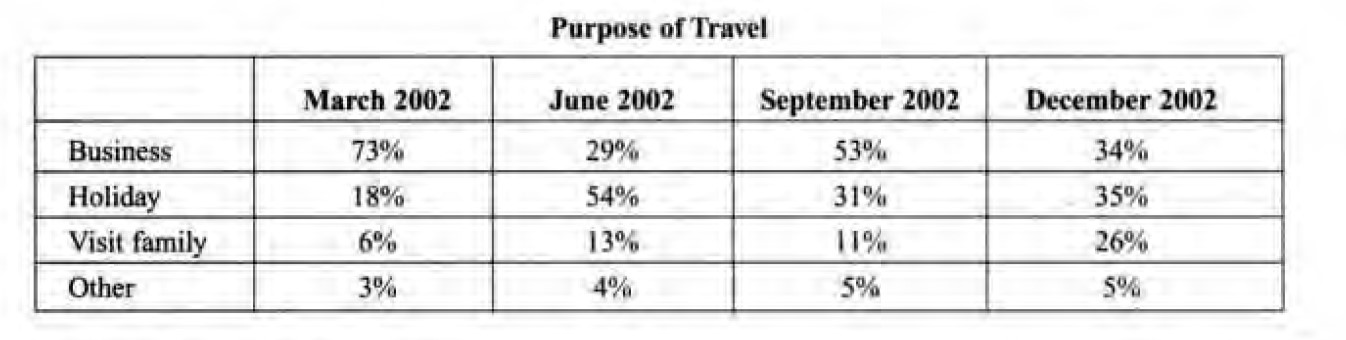
The given table data presents information about the purpose of travel by the travelers who used a major metropolitan airport. The data is taken from a survey conducted during 4 different months in the year 2002. As is given in the table data, business was the main reason people travelled and holiday seekers mostly travelled during the month of June in 2002.
According to the given illustration, business, holiday, visit to family are the three major reasons people travelled during the year 2002.
Business travel in March, 2002 comprised about three-fourth of the total travel whereas 18% trip was due to holiday while the remaining 9% were for family visits and other purposes collectively. In June,2002, people mostly travelled (54% of total travel) to spend their holidays and business trips during this month accounted to be only 29%. Family visits and other travel were cumulatively 17% in this month. Business visits during September and December were higher than that of June but less than that of March. This clearly shows that most people did business travel during the month of March and September. In December, business and holiday trips were almost the same (34% and 35% respectively) and family visits held the third highest percentage of the year in this month. The proportion of people who travelled for other purposes was the smallest(5%).
