The charts below give information about USA marriage and divorce rates between 1970 and 2000, and the married status of adult Americans in two of the years.
Summarise the information by selecting and reporting the main features, and make comparisons where relevant.
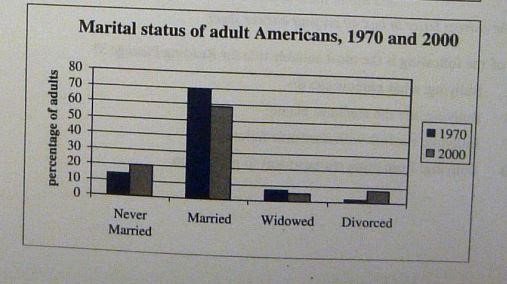
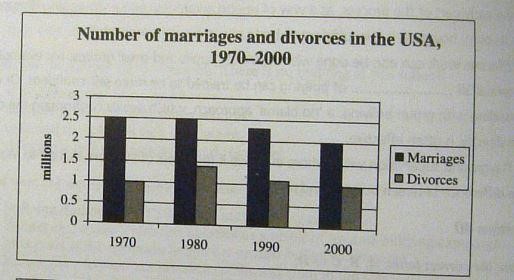
The first bar graph represents the marital status of American citizens in the years 1970 and 2000, units for which are measured in percentage. The second bar graph provides an analysis of the proportion of split ups and nuptials from 1970 to 2000, a period of 30 years whose units are calibrated in millions.
At a cursory glance, upon analysing the marital status of Americans, it can be seen that 70% of the adults were married in 1970 while this number reduced to around 60% in 2000. Meanwhile, in the year 1970, approximately 15% of the adults chose to remain single while this figure rose to 20% in the year 2000. It is also vivid that the number of divorced individuals was less than 5% in 1970, while in 2000 this proportion was nearly double as compared to 1970. As far as the figure of widows and widowers is concerned, it was 8 % in 1970 which slightly reduced in the latter year.
Probing further, the number of wedlocks in the USA showed a declining trend in the given period, while the number of divorces over the given period remained more or less the same except in 1980 when it showed an incline. It can be seen that the number of divorces in the USA from 1970 to 2000 remained a steady one million except for the year 1980 when this figure touched almost one and a half million. On the contrary, the figures for marriages showed a downward trend with two and a half million couples tying the knot in 1970 to two million couples doing the same after three decades.
