The graph below shows the number of tourists visiting a particular Caribbean island between 2010 and 2017.
Summarise the information by selecting and reporting the main features, and make comparisons where relevant.
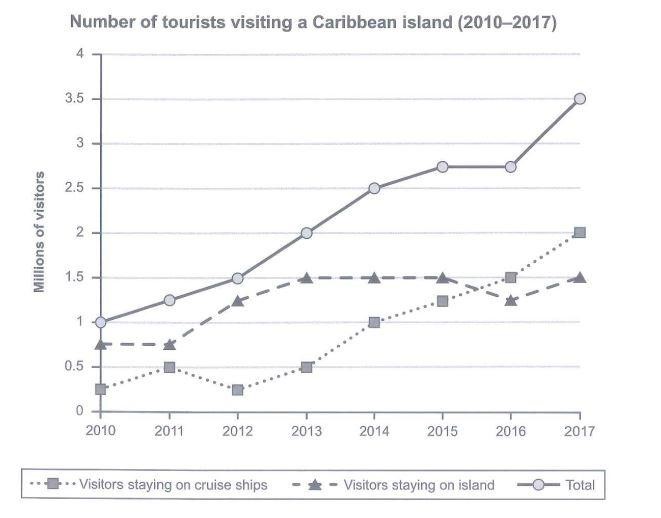
The provided line graph expresses the number of visitors who traveled to a particular Caribbean island during the course of 7 years beginning from 2010
The provided line graph expresses the number of visitors who travelled to a particular Caribbean island during the course of 7 years beginning from 2010.
Overall, the total number of visitants at the Caribbean island kept increasing during the given years.. In addition, the number of visitors staying on cruise ships was lower than that of those who preferred to stay on the island during most of the given period.
In 2010, the figure of tourists travelling to the Caribbean island was recorded at exactly 1 million, with 75,000 of them chose to stay on the island, whereas the remaining opted to stay on cruise ships. In the next 2 years, although there was an unnoticeable decline to reach the lowest level of just below 0.25 million in the amount of visitors staying on cruise ships, opting to stay on the island was still a more favourable choice with 1.25 million visitors.
In 2010, the Caribbean island experienced a sharp surge to 3.5 million in the total ratio of tourists. Similarly,, the number of tourists who stayed on cruise ships experienced a significant rise to exactly 2 million, exceeding the figure for those staying on the island which was 1.5 million.
