The graphs below show the amount of money spent on protecting crops and how crops are damaged in three different regions of the world in 2005.
Summarise the information by selecting and reporting the main features, and make comparisons where relevant.
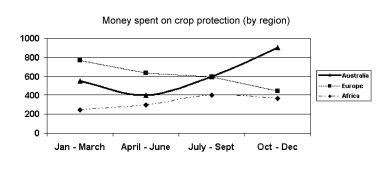
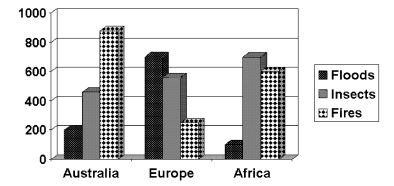
The provided line graph shows the sum of money expended on the security of crops and the presented bar graph delineates the three ways in which land is degraded in Australia, Europe and Africa in 2005.
With regards to the amount of money spent on crop protection, a number of features are clearly evident. Firstly, in the months of January to June, Europe spent the greatest amount of money on crop protection (ranging from around $800 to $600 million). For the months of July to December, Australia was the greatest spender with the final quarter (ranging from about $450 to $900 million). Over the total 2005 period, Africa was clearly the region that spent the least amount of money (ranging from around $200-400 million).
With regards to ‘type of damage to crops’, it is evident that in Australia, ‘fires’ caused the greatest damage in 2005 (around 900 million hectares). For Europe, floods had the greatest negative effect devastating 700 million hectares of farmland and a similar area of agricultural land was destroyed in Africa due to insects.
